Timothy K. Daty, M.Ed.
David L. Myers, Ph.D.
Jonathan Allen Kringen, Ph.D.
University of New Haven
Newhallville is one of twenty neighborhoods in the City of New Haven, Connecticut. With a population of roughly 6,800 residents, it is the 7th most populated neighborhood in New Haven. Newhallville is a predominantly African American and Hispanic neighborhood, accounting for over 90% of its residents. The median household income in Newhallville is $24,300. For adults between the ages of 25 and 64, 47.3% are employed, while 52.7% are either unemployed or not part of the labor force.
The Newhallville Governance Committee participated in a rigorous selection process to qualify for CBCR grant funding. A primary requirement for sponsorship is the alignment of core values between the proposed project and the CBCR. During the application process, the NSNI identified three major objectives meant to guide this project: prioritized community policing, greater engagement for juveniles, and greater quality of life for residents. Upon review, the Newhallville Safe Neighborhood Initiative (NSNI) proved suitable for CBCR assistance and was approved for implementation in April of 2017.
The Newhallville Safe Neighborhood Initiative (NSNI) was guided by one primary goal: The City of New Haven, fiscal agent of the Innovations in Community Based Crime Reduction (CBCR) grant, will lead a cross-sector partnership, The Newhallville Safe Neighborhood Initiative, to revitalize the neighborhood through the delivery of comprehensive, scientifically based, and data driven strategies that will reduce crime and violence in the neighborhood.
A logic model (see Appendix A) initially was developed and played a significant role in the strategic planning phase of the project. It presented a comprehensive view of the project and the functions associated with planning and successful implementation. The NSNI logic model addressed four major problems within Newhallville: (1) young adult & youth criminal activity, (2) few opportunities for youth to be engaged in positive youth development activities, (3) neighborhood crime hotspots and, (4) trust & collaboration between police and the community. In response to these problems, the logic model presented processes to address these issues and a means to produce positive outcomes.
First, existing resources were identified. Resources included current programs, funding, staffing, and facilities to be utilized in the project. Once the resources were identified, activities were outlined for each program. Activities are the types of actions that a program was undertaking. This can include the development of materials and training programs. Once the activities were listed, outputs were identified to measure what was happening within each activity. For the NSNI, the outputs being measured were the number of youth served and the number of individualized service plans developed. Lastly, outcomes were the positive impacts made within the project. For the NSNI, the outcomes developed in this Logic Model were directly linked to the aforementioned problems and how these problems were to be resolved.
The Governance Committee for the Newhallville Safe Neighborhood Initiative played an integral role in the planning and implementation stages of this project. While the Project Manager oversaw the daily operations of the NSNI, the governance committee provided oversight for all project activities. During the planning stage of the NSNI, the governance committee attended community meetings and partner organization meetings to strengthen communications, relations, and collaborations. In addition to overseeing the programs, the committee identified other issues within the community and the negative impacts these issues may have had on Newhallville. In identifying these issues, the governance committee discussed ways to resolve these various problems through use of existing resources.
The University of New Haven served as the research partner to the Newhallville Safe Neighborhood Initiative. Dr. Jonathan Kringen served as the principle investigator for the NSNI since the conception of the project. During the planning phase, Dr. David Myers joined the research team, and in August 2018, Timothy Daty was added as the doctoral research assistant. Together, this group was tasked with completing the research goals assigned and assessing the overall effectiveness of the initiative. The research team communicated regularly with NSNI staff and collected participant data during the project. In doing so, the research team developed a “Community Survey,” which was utilized in both 2018 and 2019 (see Appendix B). The community survey was used to measure resident perceptions of safety and police interactions. This report outlines the data collected from the community and the police, along with presenting evaluation findings in subsequent sections.
Program Partners
The NSNI was committed to co-sponsorship efforts with existing programs in the community. Through collaboration with the NSNI, these community partners were able to provide additional support to residents in Newhallville.
Youth Police Initiative (YPI)
The Youth Police Initiative (YPI) program was a program focused on juvenile engagement & relations with police. As part of the strategy, the program specifically targeted juveniles living within Newhallville. Outreach was driven by individual schools where teachers and administrators recommended students who they believed would most benefit from the YPI program.
In April of 2018, YPI program moved into its implementation phase with King Robinson Middle School where 11 students (7th & 8th graders) participated in these sessions. As part of the program, 4 New Haven police officers actively participated in the program and interacted with each youth participant. Teambuilding and group discussions were major goals for the program. Youth participants and police officers communicated with one another and shared personal stories about their experiences in Newhallville. In doing so, both parties discussed major issues happening in the neighborhood and ways to address these problems. The YPI program encouraged the youth participants to be “change agents” in their school and community. An additional goal of the program involved self-reflection. The youth often shared personal stories involving the law and any negative attitudes they hold towards law enforcement. In doing so, the YPI program was able to humanize police officers in the eyes of these youth and help these youths take accountability for their past actions. The YPI yielded several positive outcomes for both police officers and for youth involved in the programs.
For the police officers, the positive outcomes were threefold. First, police officers developed better communication skills with youth in the neighborhood. Second, police officers gained personal perspective regarding the youth experiences in Newhallville. Lastly, officers learned strategies to de-escalate issues with neighborhood youth.
The Youth respondents reported several positive outcomes from participation in the YPI. First, the youth held more favorable views of authority figures in Newhallville and police officers in the community. Second, communication between these youth and police officers improved. Lastly, the youth reported better social skills in addressing potential conflicts.
Newhallville Neighborhood Corporation
The Newhallville Neighborhood Corporation was a summer-based youth program. Historically, summer months are often characterized by the lack of community programs and increased levels of crime. The Newhallville Neighborhood Corporation engaged youth in prosocial community-based activities within a safe and supervised setting. The program was geared towards older youth & adults between the ages of 16 – 30 years old. There were two program highlights to the Newhallville Neighborhood Corporation.
- Youth programs: The Newhallville Neighborhood Corporation planned several events during summer months. Over the years, the summer basketball league was a popular event. Interest in the basketball league was fairly high among older youth. Through sponsorship with the Newhallville Safe Neighborhood Initiative, the summer basketball league achieved high participation rates (roughly 120 people). In addition, the Newhallville Neighborhood Corporation also planned other events such as music events and dance contests.
- Community activism: The Newhallville Neighborhood Corporation encouraged residents to participate in community service projects. The recruitment of volunteers for community service was a primary goal. Each week, the Newhallville Neighborhood Corporation was responsible for feeding over 300 children and families across Newhallville. These feedings are often held during critical hours of engagement.
Promise Land Initiative
The Promise Land Initiative was a summer-based program in Newhallville. A hallmark to the Promise Land Initiative was the weekly basketball tournaments offered at sponsored locations. Over the years, the Promise Land Initiative provided Newhallville youth with mentors, music tutoring, and sports programming. Through a safe and supervised setting, these youths were offered positive opportunities and encouraged to participate in community activism. As previously stated, juveniles have fewer programming opportunities during the summer months and crime rates are often higher. Unlike the Newhallville Neighborhood Corporation, the Promise Land Initiative geared its resources towards younger youth in the community. The Promise Land Initiative integrated different features to better serve the residents.
- Believe In Me Empowerment Corporation (BIMEC): Promise Land Initiative partnered with the Believe In Me Empowerment Corporation (BIMEC) to better serve Newhallville residents. The mission of BIMEC was to improve the lives of youth, young adults and their families through direct and indirect programming. BIMIC programs provided housing, life skills, and counseling services to participants. BIMEC offered life skills training to youth engaged in the Promise Land Initiative. In addition, BIMEC also engaged the community through events such as feeding Newhallville residents and training opportunities.
- Spreading Awareness: A key aspect of the Promise Land Initiative was to provide information to event attendees about various support services. Through partnership with the Newhallville Safe Neighborhood Initiative, residents of Newhallville learned about the different community resources available to them. A goal for program staff was to encourage residents to utilize these public services.
Neighborhood Housing Services
The Neighborhood Housing Services encouraged residents to become change agents within the Newhallville community. A primary focus of Neighborhood Housing Services and the Newhallville Safe Neighborhood Initiative was the revitalization of the neighborhood through community projects. To accomplish this goal, Neighborhood Housing Services offered a wide range of trainings to Newhallville residents.
These trainings introduced residents to a wide range of topics such as leadership skills, homeownership and community activism. Through these trainings, volunteers for the Newhallville Housing Services became better equipped to improve the community, particularly troubled areas in the neighborhood. Newhallville Housing Services mobilized youth and community volunteers to hotspot locations in order to alter and improve these shared areas. Improvements such as horseshoe activities and better lighting were installed. According to New Haven Police Department, noticeable differences were reported in these hotspot areas.
The Neighborhood Housing Services were responsible for many of the physical and environmental improvements made in Newhallville. Most notably, volunteers worked on several community murals in the neighborhood. With the support of local artists, these murals were developed by youth in the community. The first of these murals was displayed at the Farmington Canal.
Perfect Blend Mentoring Program and Precious Angels
The Perfect Blend Mentoring Program offered targeted programming to young women living throughout New Haven. Young women in the program were matched up with a mentor who acted as an additional support system. Through mentorship, the goal of Perfect Blend was to offer these young women positive encouragement within their daily lives and set them on a path towards positive outcomes. Oftentimes, these mentees gave back to their communities through service projects and by becoming future mentors themselves. Through partnership with the Newhallville Safe Neighborhood Initiative, the Perfect Blend Mentoring Program created programming efforts towards young women living in Newhallville.
As a NSNI partner, Perfect Blend staff identified young women living in Newhallville who would most benefit from the services provided. As part of the program, participants often engaged in field trips, college visits and skill training. Community engagement was a major component of the Perfect Blend program. Participants were encouraged to be active members of the community and engage in projects that positively impact other young women in Newhallville. As a partner within the NSNI, Perfect Blend worked closely with Precious Angels, another mentoring program geared towards female youth engagement.
Precious Angels employed a similar program structure as Perfect Blend Mentoring Program. Precious Angels targeted young women living in New Haven and offered them mentorship and community service opportunities. However, unlike Perfect Blend, the Precious Angels program was geared towards young girls in elementary/middle school. Designed with similar objectives, both Perfect Blend and Precious Angels have worked collaboratively with the NSNI to provide wide support and encouragement to young women living in Newhallville.
Newhallville Ambassadors
The Newhallville Ambassadors program was a collaboration between the Livable City Initiative (LCI) and New Haven Youth Stat. While the program was offered primarily in the summer, it provided high school students with opportunities for year-round employment through the City of New Haven’s Youth at Work Program. The Newhallville Ambassadors program identified youth who lived within hotspot areas and offered them the experience of working within the Newhallville community.
Admission into the Newhallville Ambassadors program was fairly competitive over the last several summers. Newhallville Ambassadors received interest from a wide selection of candidates for a finite number of spots. As a Newhallville Ambassador, these youths were offered a wide range of trainings related to job development, leadership principles, team building and community activism. The participants performed various community service projects including community clean-ups and other community events. In addition, these participants did several site visits throughout New Haven including visits to City Hall, Yale University, the New Haven Green and Albertus Magnus College. Through these trainings, these youth ambassadors engaged in emotional and social intelligence trainings that built community awareness and self-empowerment. The graduates were encouraged positively apply what they’ve learned into improving the Newhallville community. On August 6th, 2019, the latest group of Ambassadors presented their experiences at a formal event. The event included residents, community leaders and New Haven Mayor Toni Harp. During this presentation, the Ambassadors highlighted the major outcomes that stemmed from their participation in the program. The youth showed an eagerness to stay involved in the community and better the neighborhood.
New Haven Youth Stat
New Haven Youth Stat was a significant partner within the Newhallville Safe Neighborhood Initiative. Based in New Haven, Youth Stat is a high school intervention program that seeks to reduce justice involvement and improve health and wellness outcomes for students between elementary to post-secondary education. This initiative is a collaboration that includes the City of New Haven Youth Services Department, the New Haven Board of Education, city social services agencies, mental health professionals, community partners, and parents.
Using a data-driven strategy, Youth Stat collects and analyzes school system data in order to identify at-risk youth living in New Haven. During intake, the program staff identify the unique needs of each youth. Once these needs are addressed, a holistic approach is utilized in which at-risk youths and their families are introduced to a network of support services that extends beyond traditional school resources. This can include counseling, career training, mentoring, gang prevention & intervention, and academic support. Through positive reinforcement, these youths should display more positive behaviors.
Traditionally, the Youth Stat program generally has worked with high school students. However, through the fiscal sponsorship of the Newhallville Safe Neighborhood Initiative, Youth Stat branched its services into two distinct programs (Youth Stat I & Youth Stat II). Youth Stat I and Youth Stat II sought to capture two previously underserved populations within the community. For Youth Stat I, treatment was offered to school-aged youth who have been deemed “at-risk” by school officials. Youth Stat II initially was directed at an older group of individuals, generally at-risk or criminally-involved young adults. However, starting in January 2019, a large number of older high school students joined the Youth Stat II program as well.
Youth Stat I
Youth Stat I offered a new treatment to school-aged youth. Youth Stat I comprised students between the ages of 8 – 14 (5th – 8th graders) who currently reside in Newhallville. The participants hailed from King Robinson School, Celentano School, and Lincoln Bassett School. As of October 2019, there were 16 Newhallville participants enrolled in Youth Stat I. Prior to joining the program, 9 participants displayed at least one behavioral issue incident while in school. Also, all 16 participants had reported absences ranging from 2-26 absences during the school-year.
Since joining the Youth Stat I program, the participants displayed several positive outcomes:
- Behavioral Issues: three participants with previously reported behavioral issues displayed generally positive or pro-social behavioral patterns moving forward. The remaining participants with prior behavioral issues displayed the same or worsening behavior.
- Attendance: seven participants displayed better attendance records after joining the program. Eight participants displayed worsening attendance since joining the program.
Through participation in the Youth Stat I program, youth also were offered individualized tutoring services through staffing and professional partnerships. Additionally, safety was a primary concern. Keeping these participants involved during non-school hours (afterschool and weekends) was a primary goal for project staff. NSNI staff secured partnerships with several locations in the community: The Boys & Girls Club, New Haven Reads, and Elephant in the Room (EIR). The Boys & Girls Club of New Haven offers a wide range of programs and activities to Youth Stat I participants. This includes academic success programs, sports programs, healthy lifestyle seminars and character development programs. Seven Youth Stat I participants were involved in a program through the Boys & Girls Club. New Haven Reads is an afterschool program aimed at improving literacy among youth. Through this program, the participants were offered private tutoring, educational family support and a community book bank. One Youth Stat I participant was involved in this program. Lastly, Elephant in the Room (EIR) is a program that encouraged youth to live healthier and more focused lives. EIR was a sports club that offered boxing, physical activities, and health & wellness programs to participants. In addition, an onsite social worker was available to all EIR participants. Five Youth Stat I participants were involved in this program.
Youth Stat II
Through cooperation with the Newhallville Safe Neighborhood Initiative, Youth Stat II catered to an older group of at-risk participants. Initial implementation for the Youth Stat II program took place from October 2017 to December 2017. The target population contained individuals between the ages of 17-26 years old. Referrals for Youth Stat II derived from sources such as high schools, Adult Education, State of CT probation & parole, New Haven Police Department, street outreach, and Newhallville community organizers. A distinguishing feature to the Youth Stat II program was the commitment to professional development, school attainment, and sustainable employment. The program supported the participants’ transition into adulthood by encouraging and providing engagement with educational institutions, pre-employment trainings, hiring industries, medical and mental health providers, and other services.
Between October 2017 and December 2018, roughly 15 participants joined the program and became involved over the course of 18 months. Due to staffing transitions, this previous cohort of Youth Stat II participants ceased communication with the program in January 2019. Subsequently, an entirely new group of 25 clients was established between January 2019 and September 2019, including 5 of the previously involved participants.
During the initial meetings, NSNI staff conducted assessments for each incoming participant and evaluated their personal needs. In identifying these needs, project staff create individualized service plans that outline the specific services to be provided. Housing, employment, food, and transportation were common concerns among the participants.
For employment, staff developed two forms of support. First, through a partnership with Gateway Community College, participants took advantage of free education toward professional certifications. For individuals who were not interested in furthering their education, project staff sought out employment opportunities that fit their specific qualifications. Once hired, project staff coordinated transportation options for these individuals when the job was not local.
Providing informal counseling was also a goal for Youth Stat II staff. On average, each participant met with a staff member three times a week. During these meetings, staff members often served as a confidant for these participants. Participants felt comfortable discussing personal issues they encountered and the staff offered them specific guidance. While professional mental health services were available, none of the participants requested such services.
Data for the 25 clients (starting in January 2019 and later) indicated:
- Criminal Justice System: 15 participants had interactions with the criminal justice system prior to joining the program. Only 3 participants re-offended while enrolled in the program.
- High School: 12 participants were in high school when they joined the program. Five participants (excluding those participants already in high school) renewed their education.
- Housing: 14 participants reported improved housing situations since joining the program. One participant displayed less stable housing since joining the program.
- Employment: 10 participants gained employment, while 6 were actively seeking employment.
- Active Communication: 23 of the participants maintained regular communication with program staff.
Quantitative Data on Resident Perceptions
In summer 2018, a community survey was distributed to Newhallville residents, and this survey was re-administered in the summer of 2019 (see Appendix B). Using convenience sampling at various community events, 79 community members completed the survey in 2018, while 162 community members completed the survey in 2019. In addition to examining basic descriptive statistics, independent samples t-tests were conducted on the survey data to assess differences between groups. The findings from the surveys are presented below.
2018 Survey Data
As shown in Table 1, responses for 2018 initially were compared between youth and adults. As shown in Appendix B, the variables listed in Table 1 were scored on a scale ranging from 1 (low) to 7 (high).
|
Table 1: 2018 Youth & Adults |
|||||
|
Youth or Adult |
N |
Mean |
Std. Deviation |
Std. Error Mean |
|
|
How serious do you feel the level of crime is in your neighborhood |
Youth |
20 |
5.0500 |
1.76143 |
.39387 |
|
Adult |
55 |
5.4364 |
1.69710 |
.22884 |
|
|
How would you rate the frequency of police interactions you've experienced within the last six months |
Youth |
19 |
3.0526 |
1.98533 |
.45547 |
|
Adult |
55 |
3.0000 |
1.72133 |
.23210 |
|
|
How frequently does crime happen in your neighborhood |
Youth |
20 |
4.5000 |
1.57280 |
.35169 |
|
Adult |
55 |
4.5455 |
1.82390 |
.24593 |
|
|
How safe do you feel going out at night in your neighborhood |
Youth |
20 |
3.1000 |
1.88903 |
.42240 |
|
Adult |
55 |
3.5273 |
1.93271 |
.26061 |
|
|
How safe do you feel in your neighborhood |
Youth |
20 |
4.0500 |
1.73129 |
.38713 |
|
Adult |
55 |
4.0545 |
1.68235 |
.22685 |
|
|
Officers are intimidating to people in my neighborhood |
Youth |
20 |
4.4000 |
1.98415 |
.44367 |
|
Adult |
55 |
4.0909 |
1.77715 |
.23963 |
|
|
Police interactions in my neighborhood are usually positive |
Youth |
20 |
3.8500 |
1.72520 |
.38577 |
|
Adult |
55 |
3.8727 |
1.34790 |
.18175 |
|
|
My community offers multiple opportunities for youth involvement after school |
Youth |
19 |
3.4211 |
1.64370 |
.37709 |
|
Adult |
55 |
3.6182 |
1.62721 |
.21941 |
|
|
My community offers multiple opportunities for youth involvement on the weekend |
Youth |
20 |
3.2000 |
1.57614 |
.35244 |
|
Adult |
55 |
3.4727 |
1.64266 |
.22150 |
When comparing youth and adult perceptions, none of the differences in average variable scores reached statistical significance, suggesting that youth and adult perceptions in 2018 were fairly similar. However, considering the mean (average) scores presented:
- For crime seriousness, adults generally believed that the level of crime in Newhallville was more serious than youth (5.4 versus 5.0).
- For feelings of safety at night, both youth and adults felt moderately safe going out at night. However, adults generally felt safer going out at night than youth (3.5 vs. 3.1).
- For officer intimidation, as compared to adults, youth were more likely to agree that officers were intimidating (4.4 versus 4.1).
- For afterschool youth programming, both youth and adults felt that the number of afterschool youth programming could be improved. However, adults reported slightly higher impressions of afterschool youth programming opportunities compared to youth (3.6 vs. 3.4).
- For weekend youth programming, both youth and adults felt that the number of weekend youth programming could be improved. However, adults reported slightly higher impressions of weekend youth programming opportunities compared to youth (3.5 vs. 3.2).
- For frequency of police interactions, adults and youth held identical views in 2018. Adults and youth reported a moderate level of police interactions over the last six months (3.0 vs. 3.0).
- For crime frequency, both the youth and adult respondents held similar perceptions. Both groups felt that crime occurred somewhat frequently in the neighborhood (4.5 versus 4.5).
- For feelings of safety in the neighborhood, youth and adults held identical views. Youth and adults felt that the neighborhood was somewhat safe (4.0 versus 4.0).
- For positive police interactions, youth and adults again held identical views. Youth and adults slightly disagreed with the statement that “police interactions in my neighborhood are usually positive” (3.9 vs. 3.9).
- Finally, as shown in Table 2, 57% of the total 2018 respondents felt that the level of police presence had stayed the same in the community during the past 6 months, while 18% of the respondents believed it had decreased and 21% believed it had increased.
Table 2: 2018 Police Presence
|
Frequency |
Percent |
||
|
Valid |
Stayed the Same |
45 |
57.0 |
|
Decreased |
14 |
17.7 |
|
|
Increased |
17 |
21.5 |
|
|
Total |
76 |
96.2 |
|
|
Missing |
99.00 |
3 |
3.8 |
|
Total |
79 |
100.0 |
2019 Survey Data
Next, responses were compared between youth and adults for 2019 (see Table 3 below).
|
Table 3: 2019 Youth & Adults |
|||||
|
Youth or Adult |
N |
Mean |
Std. Deviation |
Std. Error Mean |
|
|
How serious do you feel the level of crime is in your neighborhood |
Youth |
50 |
4.9600 |
1.95834 |
.27695 |
|
Adult |
97 |
5.2165 |
1.57604 |
.16002 |
|
|
How would you rate the frequency of police interactions you've experienced within the last six months |
Youth |
47 |
3.7021 |
1.69289 |
.24693 |
|
Adult |
95 |
3.8105 |
1.61966 |
.16617 |
|
|
How frequently does crime happen in your neighborhood |
Youth |
50 |
4.5000 |
1.86537 |
.26380 |
|
Adult |
97 |
4.6701 |
1.71222 |
.17385 |
|
|
How safe do you feel going out at night in your neighborhood |
Youth |
50 |
4.1600 |
1.96251 |
.27754 |
|
Adult |
96 |
3.7708 |
1.68884 |
.17237 |
|
|
How safe do you feel in your neighborhood |
Youth |
49 |
4.7347 |
1.61730 |
.23104 |
|
Adult |
96 |
4.2500 |
1.61571 |
.16490 |
|
|
Officers are intimidating to people in my neighborhood |
Youth |
50 |
4.1200 |
1.59898 |
.22613 |
|
Adult |
97 |
3.7216 |
1.65039 |
.16757 |
|
|
Police interactions in my neighborhood are usually positive |
Youth |
50 |
3.5400 |
1.52810 |
.21611 |
|
Adult |
97 |
4.3299 |
1.36719 |
.13882 |
|
|
My community offers multiple opportunities for youth involvement after school |
Youth |
50 |
4.1200 |
1.70999 |
.24183 |
|
Adult |
97 |
3.9381 |
1.68828 |
.17142 |
|
|
My community offers multiple opportunities for youth involvement on the weekend |
Youth |
50 |
4.0400 |
1.66550 |
.23554 |
|
Adult |
96 |
3.6354 |
1.72974 |
.17654 |
When analyzing average scores across youth and adults, again, none of the differences reached statistical significance. However, the average (mean) scores suggested:
- For crime seriousness, adults generally believed that the level of crime in Newhallville was more serious than youth respondents (5.2 versus 5.0).
- For frequency of police interactions, both adults and youth reported moderate rates of police interactions. However, adults reported slightly higher levels of police interactions than youth (3.8 vs. 3.7).
- For crime frequency, both the youth and adult respondents held similar perceptions. Both groups felt that crime occurred somewhat frequently in the neighborhood. However, adults believed crime occurred slightly more frequently than youth (4.6 versus 4.5).
- For feelings of safety at night, youth generally felt safer going out at night than adults (4.1 vs. 3.8).
- For feelings of safety in the neighborhood, youth generally reported safer feelings in the neighborhood than adult respondents (4.7 versus 4.2).
- For officer intimidation, adults generally held more favorable views of police officers than youth (3.7 versus 4.1). Youth were more likely to believe that police officers were intimidating in the neighborhood.
- For positive police interactions, adults held more favorable views of police officers in the community than youth. Adults reported more favorable experiences with neighborhood police officers (4.3 vs. 3.5).
- For afterschool youth programming, both youth and adults felt that an adequate number of programs were offered in the community. However, adults reported slightly lower impressions of afterschool youth programming opportunities (3.9 vs. 4.1).
- For weekend youth programming, youth held more positive views regarding the number of weekend programs in the community. Adults reported lower impressions of weekend programming opportunities compared to youth (3.6 vs. 4.0).
- Finally, as shown in Table 4, 63% of the total 2019 respondents reported that police presence in the neighborhood had stayed the same during the past 6 months. About 12% believed that police presence had decreased, while 21% believed that police presence increased.
Table 4: 2019 Police Presence
|
Frequency |
Percent |
||
|
Valid |
Stayed the Same |
102 |
63.0 |
|
Decreased |
20 |
12.3 |
|
|
Increased |
34 |
21.0 |
|
|
Total |
156 |
96.3 |
|
|
Missing |
99.00 |
6 |
3.7 |
|
Total |
162 |
100.0 |
2018 and 2019 Survey Data Comparison
Average scores for youth respondents for 2018 subsequently were compared to those from 2019, in an effort to assess differences in youth perceptions between the two years (see Table 5 below).
|
Table 5: 2018 Youth vs. 2019 Youth |
|||||
|
Year of Survey |
N |
Mean |
Std. Deviation |
Std. Error Mean |
|
|
How serious do you feel the level of crime is in your neighborhood |
2018 |
20 |
5.0500 |
1.76143 |
.39387 |
|
2019 |
50 |
4.9600 |
1.95834 |
.27695 |
|
|
How would you rate the frequency of police interactions you've experienced within the last six months |
2018 |
19 |
3.0526 |
1.98533 |
.45547 |
|
2019 |
47 |
3.7021 |
1.69289 |
.24693 |
|
|
How frequently does crime happen in your neighborhood |
2018 |
20 |
4.5000 |
1.57280 |
.35169 |
|
2019 |
50 |
4.5000 |
1.86537 |
.26380 |
|
|
How safe do you feel going out at night in your neighborhood |
2018 |
20 |
3.1000 |
1.88903 |
.42240 |
|
2019 |
50 |
4.1600 |
1.96251 |
.27754 |
|
|
How safe do you feel in your neighborhood |
2018 |
20 |
4.0500 |
1.73129 |
.38713 |
|
2019 |
49 |
4.7347 |
1.61730 |
.23104 |
|
|
Officers are intimidating to people in my neighborhood |
2018 |
20 |
4.4000 |
1.98415 |
.44367 |
|
2019 |
50 |
4.1200 |
1.59898 |
.22613 |
|
|
Police interactions in my neighborhood are usually positive |
2018 |
20 |
3.8500 |
1.72520 |
.38577 |
|
2019 |
50 |
3.5400 |
1.52810 |
.21611 |
|
|
My community offers multiple opportunities for youth involvement after school |
2018 |
19 |
3.4211 |
1.64370 |
.37709 |
|
2019 |
50 |
4.1200 |
1.70999 |
.24183 |
|
|
My community offers multiple opportunities for youth involvement on the weekend |
2018 |
20 |
3.2000 |
1.57614 |
.35244 |
|
2019 |
50 |
4.0400 |
1.66550 |
.23554 |
As with the previously discussed results, differences in average scores did not reach statistical significance when comparing the means across the two groups. Nonetheless, the data did suggest:
- For feelings of safety in the neighborhood, youth reported feeling safer in 2019 than in 2018 (4.7 versus 4.1). This suggests that neighborhood perceptions of safety have improved over the course of the year.
- For feelings of safety at night, youth in 2019 felt safer at night than youth in 2018 (4.2 vs. 3.1). This again suggests that youth perceptions of safety have improved over the course of the year.
- For police perceptions, youth respondents reported more favorable impressions of police officer intimidation in 2019 than in 2018 (4.1 versus 4.4). More specifically, youth in 2019 felt more neutral perceptions of police intimidation.
- For frequency of police interactions, youth in 2019 reported more interactions with police officers than youth in 2018 (3.7 vs. 3.0).
- For positive police interactions, youth in 2019 reported fewer positive interactions with police officers than in 2018 (3.5 vs. 3.8).
- For afterschool youth programming, youth in 2019 held more favorable views of afterschool youth programming. More specifically, youth in 2019 felt that more afterschool programs were being sponsored than did youth respondents in 2018 (4.1 vs. 3.4).
- For weekend youth programming, youth in 2019 held more favorable views of weekend youth programming. More specifically, youth in 2019 felt that more weekend programs were being sponsored than did youth respondents in 2018 (4.0 vs. 3.2).
- For seriousness of crime, the average scored remained relatively stable from 2018 to 2019 (5.1 versus 5.0). Youth held similar views of seriousness of crime in both 2018 and 2019.
- For crime frequency, mean scores among youth were identical for both years (4.5 versus 4.5). Youth generally believed that crime occurred somewhat frequently within the neighborhood.
Next, adult perceptions for 2018 and 2019 were compared (see Table 6 below).
|
Table 6: 2018 and 2019 Adults |
|||||
|
Year of Survey |
N |
Mean |
Std. Deviation |
Std. Error Mean |
|
|
How serious do you feel the level of crime is in your neighborhood |
2018 |
55 |
5.4364 |
1.69710 |
.22884 |
|
2019 |
97 |
5.2165 |
1.57604 |
.16002 |
|
|
How would you rate the frequency of police interactions you've experienced within the last six months |
2018 |
55 |
3.0000 |
1.72133 |
.23210 |
|
2019 |
95 |
3.8105 |
1.61966 |
.16617 |
|
|
How frequently does crime happen in your neighborhood |
2018 |
55 |
4.5455 |
1.82390 |
.24593 |
|
2019 |
97 |
4.6701 |
1.71222 |
.17385 |
|
|
How safe do you feel going out at night in your neighborhood |
2018 |
55 |
3.5273 |
1.93271 |
.26061 |
|
2019 |
96 |
3.7708 |
1.68884 |
.17237 |
|
|
How safe do you feel in your neighborhood |
2018 |
55 |
4.0545 |
1.68235 |
.22685 |
|
2019 |
96 |
4.2500 |
1.61571 |
.16490 |
|
|
Officers are intimidating to people in my neighborhood |
2018 |
55 |
4.0909 |
1.77715 |
.23963 |
|
2019 |
97 |
3.7216 |
1.65039 |
.16757 |
|
|
Police interactions in my neighborhood are usually positive |
2018 |
55 |
3.8727 |
1.34790 |
.18175 |
|
2019 |
97 |
4.3299 |
1.36719 |
.13882 |
|
|
My community offers multiple opportunities for youth involvement after school |
2018 |
55 |
3.6182 |
1.62721 |
.21941 |
|
2019 |
97 |
3.9381 |
1.68828 |
.17142 |
|
|
My community offers multiple opportunities for youth involvement on the weekend |
2018 |
55 |
3.4727 |
1.64266 |
.22150 |
|
2019 |
96 |
3.6354 |
1.72974 |
.17654 |
As with previous comparisons, the differences in average scores did not reach statistical significance difference. The mean scores do suggest adult perceptions may have changed at least slightly between the two years.
- For crime seriousness, adult perceptions decreased slightly from 2018 to 2019 (5.4 versus 5.2).
- For frequency of police interactions, adults in 2019 reported more interactions with police than adults in 2018 (3.8 vs. 3.0).
- For crime frequency, adult residents in 2019 felt that crime was happening slightly more frequently in their neighborhood than did respondents in 2018 (4.7 versus 4.5).
- For feelings of safety at night, adult residents in 2019 reported improved feelings of safety at night compared to the adult respondents in 2018 (3.8 vs. 3.5).
- For feelings of safety, adult residents in 2019 reported slightly higher feelings of safety (4.2 versus 4.0).
- For police perceptions, adult residents in 2019 held more positive views of police officers. More specifically, adult residents slightly disagreed with the statement that police officers are intimidating within the neighborhood (3.7 versus 4.1).
- For positive police interactions, adult residents in 2019 reported more favorable interactions with police officers compared to the 2018 respondents (4.3 vs. 3.9).
- For afterschool youth programming, adults in 2019 held more favorable views of afterschool youth programming. More specifically, adults in 2019 felt that more afterschool programs were being sponsored than did adult respondents in 2018 (3.9 vs. 3.6).
- For weekend youth programming, adults in 2019 held slightly more favorable views of weekend youth programming. More specifically, youth in 2019 felt that more weekend programs were being sponsored than adult respondents in 2018 (3.6 vs. 3.5).
Finally, combined survey data were analyzed to compare 2018 and 2019 (see Table 7). More specifically, the responses from both youth and adults were compared between 2018 and 2019.
Table 7: 2018 vs. 2019 |
|||||
|
Year of Survey |
N |
Mean |
Std. Deviation |
Std. Error Mean |
|
|
How serious do you feel the level of crime is in your neighborhood |
2018 |
79 |
5.3924 |
1.69779 |
.19102 |
|
2019 |
162 |
5.0247 |
1.74438 |
.13705 |
|
|
How would you rate the frequency of police interactions you've experienced within the last six months |
2018 |
78 |
3.0256 |
1.75791 |
.19904 |
|
2019 |
157 |
3.7580 |
1.63457 |
.13045 |
|
|
How frequently does crime happen in your neighborhood |
2018 |
79 |
4.5190 |
1.72360 |
.19392 |
|
2019 |
162 |
4.5370 |
1.76979 |
.13905 |
|
|
How safe do you feel going out at night in your neighborhood |
2018 |
79 |
3.4304 |
1.91273 |
.21520 |
|
2019 |
161 |
3.8696 |
1.80669 |
.14239 |
|
|
How safe do you feel in your neighborhood |
2018 |
79 |
4.0253 |
1.67924 |
.18893 |
|
2019 |
160 |
4.3875 |
1.63679 |
.12940 |
|
|
Officers are intimidating to people in my neighborhood |
2018 |
79 |
4.1013 |
1.82290 |
.20509 |
|
2019 |
162 |
3.8025 |
1.67124 |
.13130 |
|
|
Police interactions in my neighborhood are usually positive |
2018 |
79 |
3.8734 |
1.46206 |
.16449 |
|
2019 |
162 |
4.0432 |
1.47167 |
.11563 |
|
|
My community offers multiple opportunities for youth involvement after school |
2018 |
78 |
3.5897 |
1.63116 |
.18469 |
|
2019 |
161 |
4.0062 |
1.66770 |
.13143 |
|
|
My community offers multiple opportunities for youth involvement on the weekend |
2018 |
79 |
3.4177 |
1.62202 |
.18249 |
|
2019 |
161 |
3.7950 |
1.71799 |
.13540 |
Again, the differences in average scores between the two groups did not reach statistical significance. However, examining the mean scores suggested:
- For crime seriousness, respondents felt that the level of crime in their neighborhood was less serious in 2019 compared to 2018 (5.0 versus 5.4).
- For frequency of police interactions, residents in 2019 reported higher frequencies of police interactions than did residents in 2018 (3.8 vs. 3.0).
- For crime frequency, the averages were nearly identical for 2018 and 2019 (4.5 versus 4.5).
- For feelings of safety at night, residents in 2019 reported higher feelings of safety at night than did residents in 2018 (3.9 vs. 3.4)
- For feelings of safety, residents in 2019 reported higher levels of safety in the community than did residents in 2018 (4.4 versus 4.0).
- For police intimidation, respondents in 2019 held more favorable views of police officer intimidation (3.8 versus 4.1). More specifically, residents in 2019 slightly disagreed with the statement that police officers were intimidating in the community.
- For positive police interactions, residents in 2019 reported slightly more positive police interactions than residents in 2018 (4.0 vs. 3.9).
- For afterschool youth programming, residents in 2019 held more favorable views of afterschool youth programming. More specifically, residents in 2019 felt that more afterschool programs were being sponsored than did respondents in 2018 (4.0 vs. 3.6).
- For weekend youth programming, residents in 2019 held more favorable views of weekend youth programming. More specifically, residents in 2019 felt that more weekend programs were being sponsored than did respondents in 2018 (3.8 vs. 3.4).
Hotspot Areas
The tables and figures below present information concerning hotspot areas within Newhallville. In partnership with New Haven Police Department, the University of New Haven research team identified three primary hotspots in the community where crime appeared at higher rates. These hotspots were identified as the Read hotspot, Dixwell hotspot, and the Star Hazel hotspot. Since conception, the NSNI staff initiated environmental improvements at these locations, and the New Haven Police Department closely monitored the activity at these locations.
Over the course of this project, the New Haven Police Department delivered raw crime data to the University of New Haven. Using enhanced crime mapping software, the University of New Haven researchers analyzed this raw data and tracked personal crimes and property crimes within these three hotspots. Personal crimes were defined as assaults (simple, sexual, aggravated), weapons violations, reports of gunshots, and fights. Property crime was defined as vandalism and thefts.
Each hotspot table below is broken up into three sections: Pre-implementation (September 2016 – August 2017), Implementation (September 2017 – August 2018) and Post-implementation (September 2018 – August 2019). The pre-implementation column displays crime data within these hotspots for the 12 months before the NSNI started implementation of their programs/activities. This presents a picture of crime before the NSNI began sponsoring programs. The implementation column reports on crime during the 12 months while programs were being implemented actively in the community. Overall, both personal and property crimes in the hotspots declined during the implementation period. The post-implementation column presents follow-up crime data during the final 12 months of the grant. While property crimes continued to decline in the hotspots, personal crimes experienced a rise in the post-implementation period.
Read Hotspot
The Read Street hotspot consists of 13 interlocking blocks including three blocks on Read Street (56 to 130 Read) as well as the adjoining cross street at Butler Street (91 to 200 Butler), Huntington Street (422 to 520 Huntington), Newhall Street (299 to 330 Newhall), Shelton Avenue (353 to 440 Shelton), and Shepard Street (32 to 140 Shepard).
Pre-Implementation Phase Implementation Phase Post-Implementation Phase
|
Month |
Personal Crime |
Property Crime |
Month |
Personal Crime |
Property Crime |
Month |
Personal Crime |
Property Crime |
|
Sept. 16 |
2 |
2 |
Sept. 17 |
2 |
3 |
Sept. 18 |
0 |
2 |
|
Oct. 16 |
3 |
4 |
Oct. 17 |
3 |
1 |
Oct. 18 |
2 |
1 |
|
Nov. 16 |
1 |
5 |
Nov. 17 |
4 |
2 |
Nov. 18 |
2 |
2 |
|
Dec. 16 |
3 |
4 |
Dec. 17 |
0 |
4 |
Dec. 18 |
3 |
4 |
|
Jan. 17 |
2 |
3 |
Jan. 18 |
2 |
2 |
Jan. 19 |
6 |
3 |
|
Feb. 17 |
1 |
3 |
Feb. 18 |
3 |
0 |
Feb. 19 |
4 |
2 |
|
Mar. 17 |
6 |
1 |
Mar. 18 |
0 |
1 |
Mar. 19 |
5 |
2 |
|
Apr. 17 |
5 |
3 |
Apr. 18 |
3 |
2 |
Apr. 19 |
2 |
2 |
|
May. 17 |
5 |
7 |
May. 18 |
4 |
2 |
May. 19 |
6 |
2 |
|
Jun. 17 |
6 |
1 |
Jun. 18 |
1 |
9 |
Jun. 19 |
4 |
4 |
|
July. 17 |
3 |
6 |
July. 18 |
1 |
0 |
July. 19 |
4 |
3 |
|
Aug. 17 |
3 |
7 |
Aug. 18 |
2 |
2 |
Aug. 19 |
6 |
6 |
|
TOTAL |
40 |
46 |
TOTAL |
25 |
28 |
TOTAL |
44 |
33 |
Prior to implementation, during the 12-month period, Newhallville had a total of 40 personal crimes and 46 property crimes within the Read Hotspot. During the implementation period, both personal crime and property crime declined by 38% and 39% respectively. In the post-implementation period, however, both personal and property crime rose by 76% and 18% respectively. Trend graphs for Read Street are presented below.
Pre-Implementation Implementation Post-Implementation
Pre-Implementation Implementation Post-Implementation
Star Hazel Hotspot
The Star Hazel hotspot is composed of three total blocks including 181 to 294 Starr Street, 41 to 150 Hazel Street, and the connecting block of 209 to 224 Shelton Avenue. This hotspot adjoins the Dixwell hotspot extending to the northeast of the Dixwell hotspot.
Pre-Implementation Phase Implementation Phase Post-Implementation Phase
|
Month |
Personal Crime |
Property Crime |
Month |
Personal Crime |
Property Crime |
Month |
Personal Crime |
Property Crime |
|
Sept. 16 |
0 |
1 |
Sept. 17 |
2 |
3 |
Sept. 18 |
1 |
0 |
|
Oct. 16 |
2 |
3 |
Oct. 17 |
3 |
4 |
Oct. 18 |
0 |
1 |
|
Nov. 16 |
3 |
1 |
Nov. 17 |
5 |
1 |
Nov. 18 |
1 |
1 |
|
Dec. 16 |
3 |
2 |
Dec. 17 |
6 |
3 |
Dec. 18 |
0 |
1 |
|
Jan. 17 |
0 |
1 |
Jan. 18 |
2 |
1 |
Jan. 19 |
2 |
0 |
|
Feb. 17 |
1 |
4 |
Feb. 18 |
1 |
1 |
Feb. 19 |
4 |
1 |
|
Mar. 17 |
0 |
2 |
Mar. 18 |
0 |
0 |
Mar. 19 |
1 |
2 |
|
Apr. 17 |
0 |
1 |
Apr. 18 |
1 |
1 |
Apr. 19 |
1 |
1 |
|
May. 17 |
3 |
1 |
May. 18 |
4 |
1 |
May. 19 |
1 |
1 |
|
Jun. 17 |
3 |
2 |
Jun. 18 |
3 |
0 |
Jun. 19 |
0 |
1 |
|
July. 17 |
2 |
2 |
July. 18 |
1 |
3 |
July. 19 |
1 |
2 |
|
Aug. 17 |
2 |
7 |
Aug. 18 |
1 |
3 |
Aug. 19 |
1 |
3 |
|
TOTAL |
19 |
27 |
TOTAL |
29 |
21 |
TOTAL |
13 |
14 |
Prior to implementation, during the 12 month period, Newhallville had 19 personal crimes and 27 property crimes within the Star Hazel Hotspot. During the implementation period, personal crime increased by 53%, while property crime declined by 22%. In the post-implementation period, both personal and property crime declined by 55% and 33% respectively. Trend graphs for Star Hazel are presented below.
Pre-Implementation Implementation Post-Implementation
Pre-Implementation Implementation Post-Implementation
Dixwell Hotspot
The Dixwell hotspot is composed of eight total blocks, including four blocks on Dixwell Avenue (ranging from 507 Dixwell to 600 Dixwell). In addition, the Dixwell hotspot includes two intersecting blocks of Shelton Avenue (151 Shelton to 202 Shelton), one intersecting block of Division Street (263 Division to 340 Division), and one intersection block on Thompson Street (151 Thompson to 200 Thompson).
Pre-Implementation Phase Implementation Phase Post-Implementation Phase
|
Month |
Personal Crime |
Property Crime |
Month |
Personal Crime |
Property Crime |
Month |
Personal Crime |
Property Crime |
|
Sept. 16 |
3 |
4 |
Sept. 17 |
3 |
5 |
Sept. 18 |
1 |
1 |
|
Oct. 16 |
8 |
5 |
Oct. 17 |
3 |
10 |
Oct. 18 |
6 |
2 |
|
Nov. 16 |
4 |
3 |
Nov. 17 |
4 |
4 |
Nov. 18 |
5 |
3 |
|
Dec. 16 |
3 |
3 |
Dec. 17 |
1 |
0 |
Dec. 18 |
6 |
3 |
|
Jan. 17 |
4 |
0 |
Jan. 18 |
3 |
7 |
Jan. 19 |
5 |
6 |
|
Feb. 17 |
1 |
4 |
Feb. 18 |
4 |
3 |
Feb. 19 |
4 |
3 |
|
Mar. 17 |
1 |
3 |
Mar. 18 |
2 |
0 |
Mar. 19 |
4 |
3 |
|
Apr. 17 |
4 |
0 |
Apr. 18 |
4 |
0 |
Apr. 19 |
6 |
1 |
|
May. 17 |
4 |
2 |
May. 18 |
2 |
3 |
May. 19 |
0 |
1 |
|
Jun. 17 |
9 |
1 |
Jun. 18 |
3 |
1 |
Jun. 19 |
2 |
2 |
|
July. 17 |
1 |
4 |
July. 18 |
1 |
6 |
July. 19 |
5 |
7 |
|
Aug. 17 |
3 |
3 |
Aug. 18 |
1 |
6 |
Aug. 19 |
1 |
4 |
|
TOTAL |
45 |
32 |
TOTAL |
31 |
45 |
TOTAL |
45 |
36 |
Prior to implementation, during the 12 month period, Newhallville had 45 personal crimes and 32 property crimes within the Dixwell Hotspot. During the implementation period, personal crime declined by 31%, while property crime increased by 40%. In the post-implementation period, personal crime increased by 45% and property crime declined by 20%. Trend graphs for Dixwell are presented below.
Pre-Implementation Implementation Post-Implementation
Pre-Implementation Implementation Post-Implementation
All Hotspot Data
The tables and graphs below demonstrate the overall crime trends happening within all three hotspots. Prior to the implementation phase of the Newhallville Safe Neighborhood Initiative, during the 12-month period, 104 personal crimes and 105 property crimes had occurred in these three hotspots. During the implementation phase of project, both personal crime and property crime declined by 18% and 11%, respectively. This would suggest that the NSNI-sponsored programs and initiatives had a positive effect on the community in reducing crime. However, in fall 2018, personal crimes started to steadily increase, while property crimes showed a continued decline. Personal crime increased by 20% during post-implementation, while property crime decreased by 12%.
Pre-Implementation Phase Implementation Phase Post-Implementation Phase
|
Month |
Personal Crime |
Property Crime |
Month |
Personal Crime |
Property Crime |
Month |
Personal Crime |
Property Crime |
|
Sept. 16 |
5 |
7 |
Sept. 17 |
7 |
11 |
Sept. 18 |
2 |
3 |
|
Oct. 16 |
13 |
12 |
Oct. 17 |
9 |
15 |
Oct. 18 |
8 |
4 |
|
Nov. 16 |
8 |
9 |
Nov. 17 |
13 |
7 |
Nov. 18 |
8 |
6 |
|
Dec. 16 |
9 |
9 |
Dec. 17 |
7 |
7 |
Dec. 18 |
9 |
8 |
|
Jan. 17 |
6 |
4 |
Jan. 18 |
7 |
10 |
Jan. 19 |
13 |
9 |
|
Feb. 17 |
3 |
11 |
Feb. 18 |
8 |
4 |
Feb. 19 |
12 |
6 |
|
Mar. 17 |
7 |
6 |
Mar. 18 |
2 |
1 |
Mar. 19 |
10 |
7 |
|
Apr. 17 |
9 |
4 |
Apr. 18 |
8 |
3 |
Apr. 19 |
9 |
4 |
|
May. 17 |
12 |
10 |
May. 18 |
10 |
6 |
May. 19 |
7 |
4 |
|
Jun. 17 |
18 |
4 |
Jun. 18 |
7 |
10 |
Jun. 19 |
6 |
7 |
|
July. 17 |
6 |
12 |
July. 18 |
3 |
9 |
July. 19 |
10 |
12 |
|
Aug. 17 |
8 |
17 |
Aug. 18 |
4 |
11 |
Aug. 19 |
8 |
13 |
|
TOTAL |
104 |
105 |
TOTAL |
85 |
94 |
TOTAL |
102 |
83 |
Pre-Implementation Implementation Post-Implementation
Pre-Implementation Implementation Post-Implementation
Overall Crime Statistics
The pages below present year-to-date crime data for Newhallville and the City of New Haven. The data below derives from the New Haven Police Department and their weekly Comparison Crime Report Statistics (Compstat). Compstat reports present comparative statistics regarding certain periods of time. For the tables below, crime data from January 2018 – August of 2018 is compared against crime data from January 2019 – August 2019 in Newhallville. Moreover, the crime data is split up into three categories: violent crime, property crime and other crime. Each table presents data for the three aforementioned categories. Overall, the crime data shows moderate decreases in violent crime, property crime and other crime. However, there have been notably sharp increases in the areas of assault with firearm victims and weapons violations. Increases in these two areas seem to be correlated. The number of weapons violations in Newhallville increased significantly over the last ten months. With this increase of weapons on the street, the number of assault with firearm victims increased as well. More detailed summaries of each crime can be found in the subsequent sections.
Violent Crime
*Note: the violent crime statistics being reported represent a very small number of incidents. When dealing with a small number of incidents, small changes can highly inflate the crime statistics (as seen with Felony Sexual Assault).
The table above represents an 8-month comparative analysis of official violent crime in the entire police district of Newhallville. The data present violent crime from January 1st to August 25th and compares year-to-date crimes for 2019 against the year-to-date crimes for 2018. Overall, violent crimes in Newhallville exhibited moderate declines (14.2%) in 2019.
Violent crime reductions:
- As of August 2019, no murders have occurred in Newhallville. This is an improvement from the previously reported murder in 2018.
- Felony sexual assault has decreased 33.3% in 2019
- Robbery with firearm has decreased 30% in 2019
- Other Robbery has decreased by 47.6% in 2019
- Aggravated Assault has decreased by 9.7%
Violent crime increases:
- Assault with firearm victims has 116.7% in 2019
City of New Haven Comparison
Overall, these reductions are consistent with overall crime trends for all of New Haven. The City of New Haven reported overall crime reductions in the areas of murder, felony sexual assault, robbery with firearm, and other robbery. Like Newhallville, the City of New Haven also experienced higher levels of assault with firearm victims. However, Newhallville showed more promising statistics in the area of aggravated assault. Newhallville showed a decline in aggravated assaults for 2019, while the City of New Haven experienced an increase in aggravated assaults.
The table below illustrates an 8-year analysis of homicide, non-fatal shooting victims, and confirmed shots fired in New Haven, Connecticut. Between 2011 and 2015, confirmed shots fired showed a steady decline. However, in recent years, the confirmed shots fired has been increasing, and the number of non-fatal shooting victims also been increasing, particularly from 2018 to 2019.
Property Crime
2019 2018 Cng 2019 Cng 2019 2018 Cng 2019 2018 Cng
The table above represents an 8-month comparative analysis of property crime in the entire police district of Newhallville. The data presents property crime from January 1st to August 25th and compares year-to-date crimes for 2019 against the year-to-date crimes for 2018. Overall, property crime rates in Newhallville showed moderate declines (11.7%) in 2019.
Property crime reductions:
- Burglary levels have decreased by 26.8% in 2019
- Motor-Vehicle Thefts have decreased by 30% in 2019
- Larceny From Vehicles have decreased by 13.4% in 2019
Property crime increases:
- Other Larceny increased in 2019 by 3.1%
City of New Haven Comparison:
These numbers are fairly consistent with the City of New Haven. However, the City of New Haven experienced crime reductions in all forms of property crime, whereas Newhallville showed an increased in one form of property crime (other larceny).
Other Crime
2019 2018 Cng 2019 Cng 2019 2018 Cng 2019 2018 Cng
The table above represents an 8-month comparative analysis of “other crime” in the entire police district of Newhallville. The data presents other crime from January 1st to August 25th and compares year-to-date crimes for 2019 against the year-to-date crimes for 2018. Overall, other crime rates in Newhallville remained nearly identical between 2018 and 2019. However, a slight 0.5% crime decline was observed in 2019.
Other crime reductions:
- Simple Assault decreased by 11.3% in 2019
- Drugs & Narcotics decreased by 21.8%
No changes between 2018 and 2019
- Prostitution remained stable at zero incidents
- Vandalism remained stable at 211 reported incidents
Other crime increases:
- Intimidation & Threatening increased by 10.6% in 2019
- Weapons Violations increased by 60.5% in 2019
City of New Haven Comparison:
These numbers are fairly consistent with the overall crime statistics reported by the City of New Haven. The City of New Haven experienced overall reductions in simple assault, prostitution, drugs & narcotics and vandalism. In contrast, the city experienced increases in intimidation & threatening and weapons violations. As such, there were not large deviations between Newhallville and the City of New Haven in the crime statistics.
Qualitative Data on Resident Perceptions
In the last few months of the Newhallville Safe Neighborhood Initiative, The University of New Haven research team conducted individualized focus groups for both adult residents and youth residents.
Adult Focus Group
Community leaders were invited to a governance committee meeting on August 5, 2019, to discuss the results and conclusion of the NSNI project. The focus group of eight participants included Newhallville residents and the New Haven Police Department.
Perceptions of Youth Crime in Newhallville
While members of this group still acknowledged the presence of youth crime in the neighborhood, they did believe that reductions were achieved throughout the community. While youth crime appeared to be decreasing, the committee discussed how the average age of “problem people” in the neighborhood had risen. More specifically, older individuals seem to have committed more crimes around the neighborhood than before. While this was an issue, the committee discussed how community responses to such crime also have improved dramatically. Although certain areas of Newhallville were experiencing higher levels of crime, the committee discussed numerous physical improvements that had been made to the previously identified hotspots. The committee discussed how Byrne Grant funds have been used to improve the streets and clean up disordered areas. Also, loitering had decreased. Police collaboration and Youth Stat were also discussed as being beneficial to the community.
Police engagement with the community had led to several positive outcomes for residents. Police were actively taking a preventative approach in crime control. This had been a core focus. In working collaboratively with community members, the police had removed many troublesome individuals from the streets. In addition, police officers were able to identify at-risk individuals and refer them to several support programs.
Partnership with the Youth Stat program was especially beneficial. Youth who required additional support were often identified and helped. For example, the committee discussed one particular instance of youth support. The NSNI was able to identify a high school female who emigrated here from another country. Before the program reached out to her, she was often scared to go school and feared for her mother’s safety. Through public services offered in the community, this young woman was provided a wide range of support which eased her overall fears.
Youth Engagement
The governance committee was quite optimistic about the positive changes made within the community concerning the multiple opportunities for youth engagement. Since the program started, youth engagement had been a primary goal for this committee. A large number of youth participated in summer activities and year-round programs in Newhallville. The learning corridor had been especially beneficial for youth. The learning corridor served as a new place where youth can socialize and learn. The police had been actively identifying at-risk youth and putting them in touch with the appropriate people. Several schools also improved since the start of the program. Activities had expanded both inside and outside the classroom. Juveniles were more actively engaged, and peer mentorship has produced many positive outcomes. Street outreach workers also worked closely with the schools to provide additional support services to youth.
Physical Improvements to Newhallville
Several improvements were made to the learning corridor. Previously, the learning corridor had many issues. However, it improved over time. Better lighting was needed in the neighborhood, as lighting and cameras are key for crime reduction. This also related to the trimming of trees. By trimming more trees in the neighborhood, lighting was improved. Many people still felt unsafe in the neighborhood. With a recent shooting that happened in the community, residents desired more police patrolling the neighborhood. Unfortunately, this was not feasible, due to police officer shortages.
While residents felt safer than in past years, overall perceptions of safety in the neighborhood were still an issue. The committee had been working actively with the police in identifying problem areas and addressing issues that arose in the neighborhood. During this period, a youth living alone in a drug-infested home was identified and provided support services from community officials. Additionally, a book library was added.
Police & Community Interactions
The governance committee discussed transitions for when new lieutenants have been assigned to Newhallville. In previous years, the governance committee expressed their displeasure when a new lieutenant was assigned to Newhallville. Over the past several years, 3-4 lieutenants had been assigned to the neighborhood. However, the committee discussed how momentum generally carried over with the transition of each lieutenant. In speaking about the current Lieutenant, the committee expressed very favorable perceptions of her work within the community. They highlighted her responsiveness to community issues and her proactive initiatives throughout the streets. The members discussed how she had an excellent relationship with youth in the community. The police have taken on a “community policing” approach throughout the neighborhood. The members discussed how residents were no longer afraid to call the police when an issue arose. In particular, members of the committee maintained regular contact with the Lieutenant and alerted her to any issues that arose.
Community Responses to Crime
According to the group, residents in the community were more willing to talk after a serious incident occurred. The Lieutenant had developed strong relationships with residents in Newhallville. These relationships created positive collaboration among residents and police. In addition, the residents discussed better outward responses to serious incidents that occurred in the neighborhood. More specifically, there were more public services available to residents than in previous years. The police were more proactive in situations where a child was involved and child protective services was needed.
Individual Testimonials
- A resident discussed how violent crime in the neighborhood was her primary concern; after the program, she believed that property crime was a larger concern.
- A resident reflected on crime over the past few years. Previously, she was afraid to walk down the streets by herself. Since the program, she felt more comfortable walking the streets, since she has become more familiar with the residents in the community.
- A resident discussed her feelings of safety around her home. She discussed overall lighting in her neighborhood and how her car was recently vandalized while it was parked in her driveway. This member discussed how she was afraid to go back to her home at night. She also discussed a recent incident where one of her neighbors was screaming for help in the middle of the night. She immediately called the police. She waited by her door for 75 minutes before a police officer arrived. However, after a recent social event that happened in Newhallville, this member stated that she had never felt safer in the neighborhood.
Youth Focus Group
A focus group also was conducted with actively engaged youth within Newhallville. This focus group was convened on August 6, 2019, and included six youth from the community. These youth discussed the impact of NSNI-led initiatives within the community and how these programs shaped their own development. Through community-led programs, youth reported a greater sense of community within Newhallville. Prior to joining NSNI-sponsored programs, many of these youth felt isolated from other people. They discussed how community cohesion appeared weak within Newhallville. However, after becoming actively engaged in the community, they saw the neighborhood in a more positive light. Increased juvenile programs have helped youth feel safer within Newhallville and also taught them about their role within the larger community. Many of these youth discussed how the NSNI helped them develop greater skillsets, including planning/preparation, organizational development, self-expression and public speaking. Since joining these programs, these youth have become more actively engaged. This active engagement led to stronger desires to improve the community. While the NSNI-sponsored programs were set to end in September 2019, many of the youth still intended to be actively engaged within other community projects.
Conclusion
The Newhallville Safe Neighborhood Initiative (NSNI) appears to have made a beneficial impact within the Newhallville community. NSNI sponsored a wide-range of programs and activities within the neighborhood. Residents, both youth and adult, reported positive feedback in response to the initiative, and survey responses indicated a number of improved community perceptions from 2018 to 2019. Several measures of crime also indicate beneficial results, with a few exceptions. The NSNI ended formally on September 30, 2019, and several lessons can be derived from this project.
- Continued efforts to strengthen and maintain strong police-community relationships are highly encouraged. Community residents and stakeholders have reported positive feedback concerning police-community interactions. When the Newhallville Safe Neighborhood Initiative was first conceived, community trust of police was quite low. Residents were distrustful of police officers, which contributed to poor community cohesion within Newhallville. However, through various community policing practices, the New Haven Police Department has improved relationships with Newhallville residents.
- Consistent collaboration among project partners and researchers is a key element for success. For government-funded projects particularly, strong partnerships between practitioners and researchers is imperative. Keeping an open communication between project staff and the research team helps ensure that a data-driven approach is being employed. Moreover, it allows for consistent evaluation and assessment during a project’s duration. Through this type of partnership, practitioners and researchers can determine areas of success and areas of improvement. For the latter, collaborative efforts between these two partners often can lead to successful adjustments within a project.
- Proper data storage and management is instrumental within effective programs, including those serving at-risk youth and adults. In January 2019, NSNI staff encountered several issues during the transition of leadership. Much of the data and records from previous years had not been properly stored, which created obstacles for the new staff. These obstacles made their acclimation more challenging. Moreover, this may have stalled somewhat the positive momentum being observed in the community during the implementation period. For future projects, considerations for continuity of leadership and services are recommended. More specifically, data records should be stored and organized so that changes in leadership would not produce a negative impact within community projects.
- Expanding resources and evidence-based programming toward educational and employment services, childcare services, and afterschool programs is recommended. These were areas of need expressed in the community surveys, and evidence-based programming exists in these areas that likely would be beneficial to the Newhallville community.
APPENDIX B
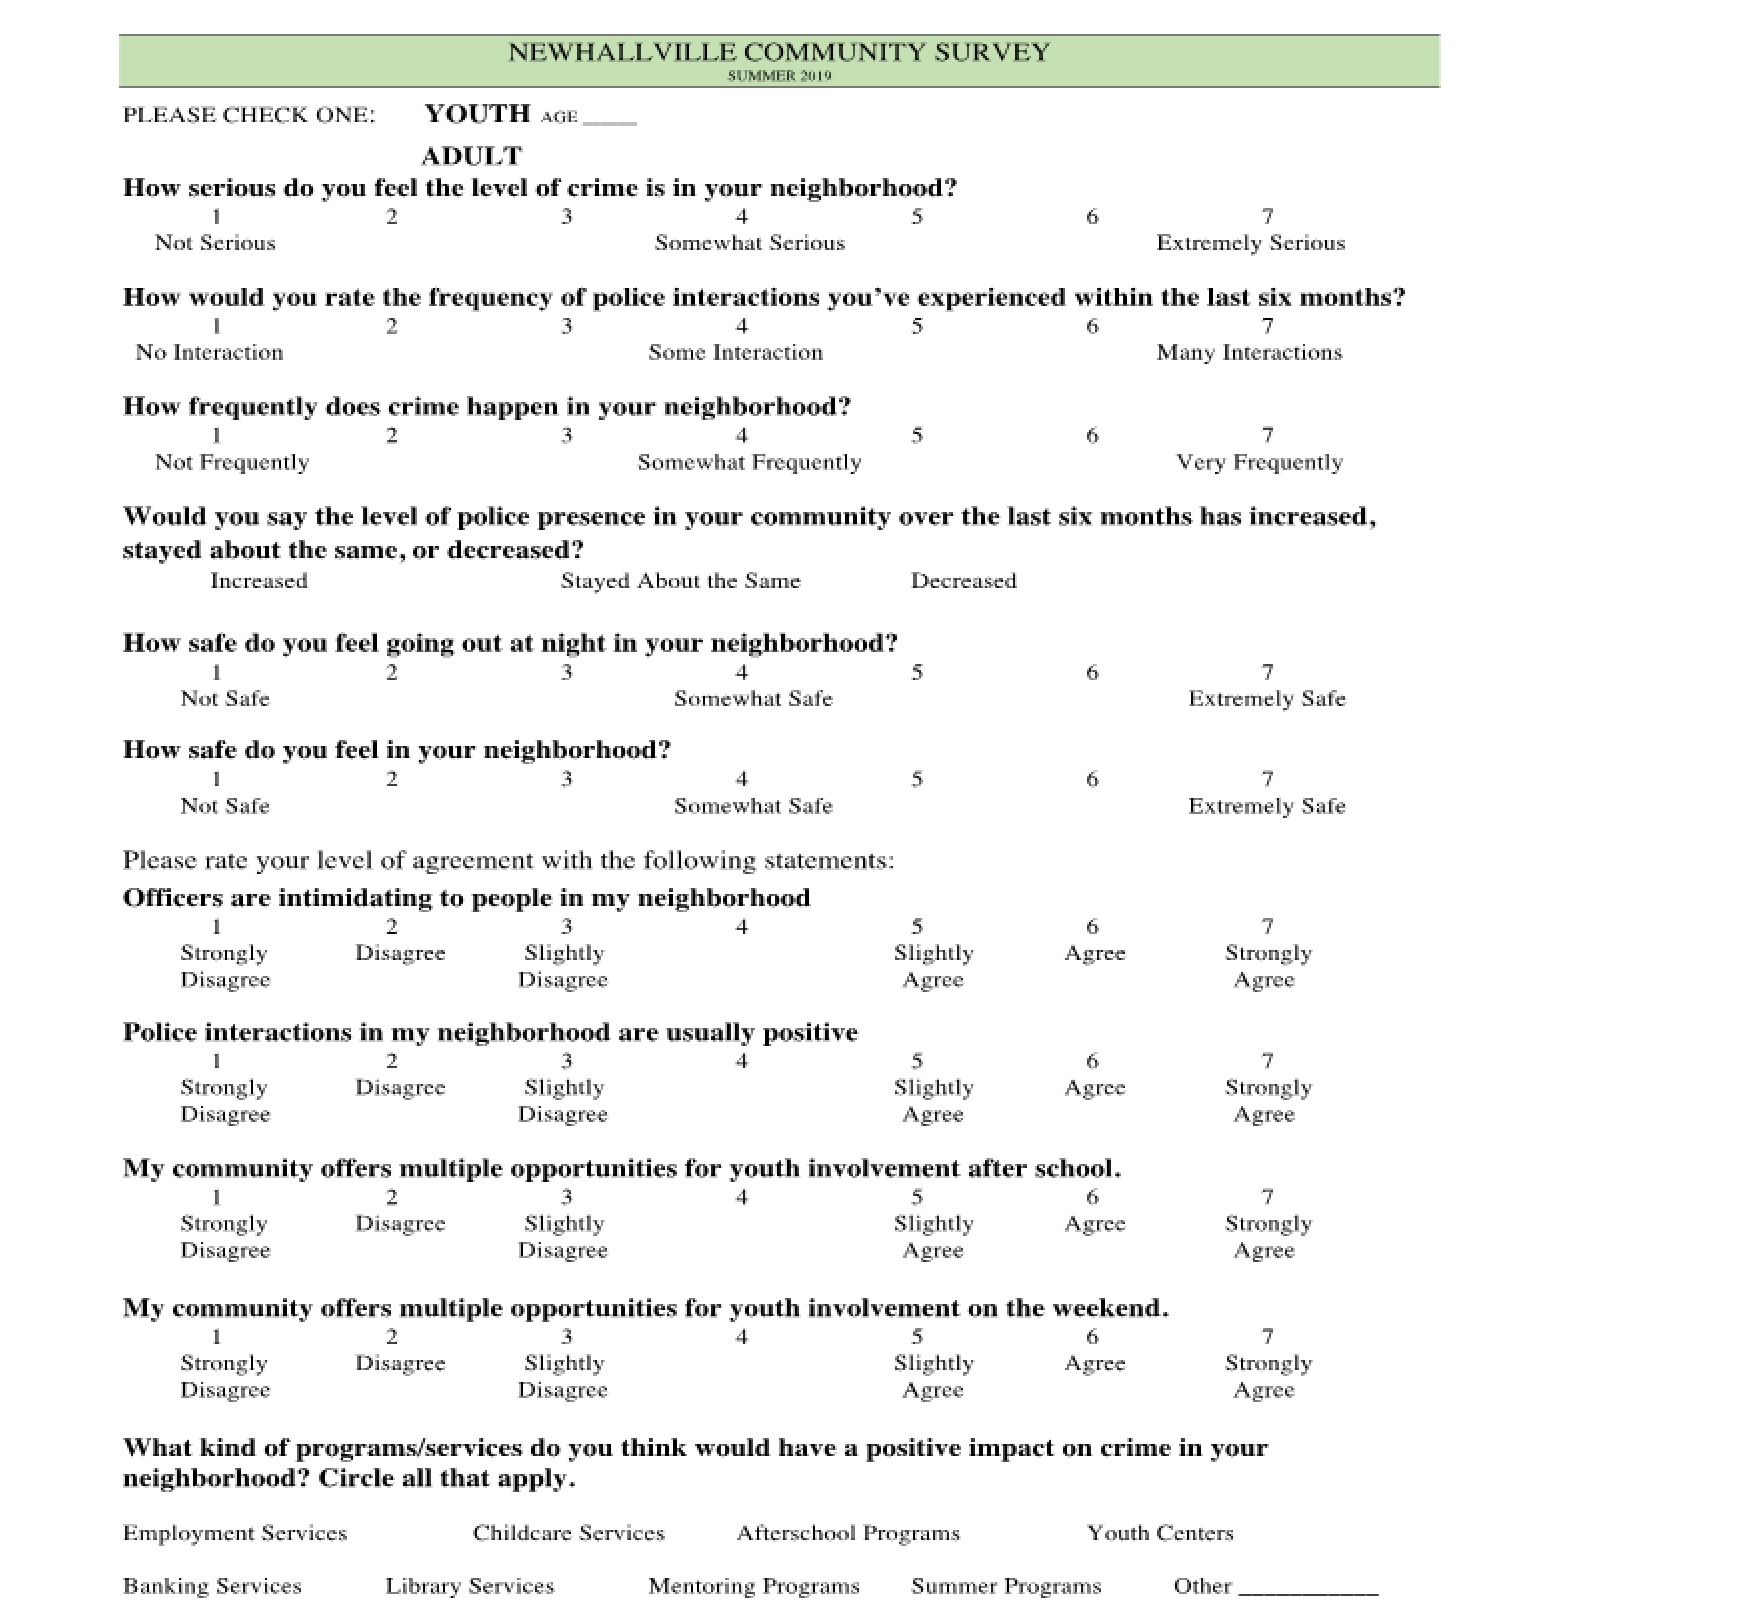
Photo by Justine Canlas on Unsplash


Evidence-Based Professionals' Monthly - April 2026

Evidence-Based Professionals' Monthly - March 2026

Evidence-Based Professionals' Monthly - February 2026

Evidence-Based Professionals' Monthly - January 2026

"EBP Day" Event Login Portal

Evidence-Based Professionals' Monthly - December 2025

Substance Use Disorders (SUDs) Masterclass: Core & Advance Skills for Evidence-Based Practitioners
Trauma Informed Care Services