Giovanni Circo, Ph.D.
Young Wang, M.S.
University of New Haven
Quality assurance practices (QA) are an important tool to ensure that program initiatives are being implemented consistently and correctly. Fidelity to the core principles of any program is a key issue for many organizations. In the realm of community-based corrections, whereby an intervention is delivered by a case manager to a group of clients, QA reflects the skill and ability of a case manager to identify client issues, to provide support for clients, and to assign clients to proper outpatient treatment(s). While it is widely agreed that QA is important to organizations, the specific role that it plays in client outcomes is less well known. With this in mind, we utilize data obtained from Community Solutions, Incorporated (CSI) in order to identify how the CSI QA model can affect client success as part of CSI’s Alternatives in the Community (AIC) program. Of primary interest is whether the QA process is linked to client-level outcomes – such as program completion and recidivism. To address this question, we consider two primary outcomes for this analysis. Specifically, we examine (1) whether the probability of completing the AIC program is affected by a case manager’s QA score and (2) whether 3-year re-arrest rates are also affected by case manager QA scores. Below, we discuss the role of QA more generally within community corrections and then discuss the specific QA model utilized by CSI. In our analysis we focus on both the general impact of QA on client-level outcomes, and then identify whether these impacts are equivalent across race and gender categories.
Quality Assurance and the CSI Coaching Model
For correctional interventions, finding the necessary characteristics and conditions for any given program to “work” (i.e., being effective at reducing recidivism) remains a central challenge (Latessa & Lowenkamp, 2005). This leads to a discussion of QA - the procedures used to check the quality of work output - since regular audits conducted by staff and stakeholders are associated with improved program outcomes in general (Wandersman, 2014). For community corrections, research finds initial training supplemented by monthly, continuing coaching sessions, may improve fidelity to implementing evidence-based research into practice (Labrecque & Smith, 2017). For juvenile offenders, counselors categorized as incompetent by quality assurance checks are less effective at reducing recidivism (Barnoski, 2004). Furthermore, programs scoring higher on treatment integrity, targeting higher risk youth and their dynamic risk factors via cognitive behavioral therapy, are more effective at reducing recidivism (Lowenkamp et al., 2010).
Program level challenges
While programs look to invest in employing trained and qualified staff, a central challenge is the management of organizational politics. It is quite difficult to comprehensively reform an agency’s infrastructure where staff genuinely believe senior management is committed to data driven performance assessment if they are not continuously updating and rewriting standards to better reflect an evidence-based mission statement (Schlager, 2009). As agencies strive to implement new and better practices, there must be alignment between the implementation at the staff level and the complementary measurement of effectiveness at the senior management level. Without this, the models lose integrity over time, and staff are not engaged in ongoing assurance of fidelity. Similarly, middle managers often express the qualitative sentiment of doing the best they can with what they have, despite awareness of best, evidence-based practices (Kras et al., 2017).

The need for QA- recidivism research at the individual client- case manager level
While organizational factors indeed impact implementation of evidence-based practices, if effective programs rely on effective individuals, there is a need for more quantitative research at the individual level of analysis. Individual community supervision officers are tasked with the actual application of skills and techniques (Bourgon, 2013). More recent research suggests that probation officers do hold favorable attitudes towards staff training, and such training programs may be effective at increasing use of trained skills (Viglione et al., 2020, Viglione & Labrecque, 2020). However, this study adds to the understanding of how exactly the quality of an individual case manager, or probation officer, affects client program completion and criminal recidivism in an adult community correctional setting. This requires an organization to keep data on clients as the units of analysis and store measures of client success. But more importantly, an organization’s data must link each client to their corresponding case manager who has been assessed with a quantitative measure of model fidelity and overall quality of the intervention applied.
The Learning Institute at CSI developed a QA Coaching Model that outlines a comprehensive process involving the review and analysis of, and skill-enhancing feedback for, staff/client interactions and staff facilitation of evidence-based group interventions. QA Coaches provide performance feedback in a strength-based manner, utilizing and modeling the principles of motivational interviewing throughout the process. Staff record client and group sessions, and subsequently send recordings to the coaches to review and evaluate, according to fidelity measures and evidence-based performance indicators. Staff QA feedback sessions occur once per month and include a review of the most critical aspects of each reviewed session, coach ratings of staff skills utilizing fidelity instruments, skill-enhancing activities, and goal setting. Coaching feedback sessions seek to enhance gains from one session to another and encourage growth for each staff participant to reach and sustain high levels of proficiency for each intervention.
Data
For analysis, we obtained client-level data from 2014 through 2015, reflecting 2,229 unique clients and 52 case managers at the AIC program, which is akin to a day reporting center. These data represented individuals who were primarily under supervision as part of adult probation (51%), bail (26%), or a family criminal case (23%). The median number of days these clients were supervised by the AIC was 90 days. We also obtained 3-year arrest histories for all clients from the Connecticut Judicial Branch, Court Support Services Division (JBCSSD). These records listed the date of any arrest subsequent to discharge from an AIC program.
We considered two primary outcomes for our analysis: (1) successful completion of an AIC program and (2) 3-year re-arrest rates. To accomplish this, we used logistic regression to model the probability of a client successfully completing an AIC program or being re-arrested after three years, as a function of both client-level and case manager-level variables. The client-level variables included the client’s sex, race, age, and employment status at intake (for Model 1) and at discharge (for Model 2). For the case manager variables, we included their QA assessment score rank, their tenure (in years) at CSI, and the total number of clients managed. Including these variables helps us to more precisely estimate the effect of QA net of other factors related to client outcome. For example, case managers with higher QA scores often have longer tenures at CSI. Finally, we adjusted for site-level differences by including a variable indicating which of the five AIC sites the clients attended: Bridgeport, Danbury, New London, Norwich, or Torrington.
The primary independent variable of interest, QA score, was defined as the average of one or more QA scores for each case manager between 2014 and 2015. While the scores potentially range from 0 to 20, in practice they are scored on a more discrete scale (for example, the lowest observed score was 8). Therefore, we categorized case managers into four groups based on their average assessed score: not assessed, 8 to 12, 13 to 17, and 18 or more. We chose to include case managers who had not yet been engaged in QA as a way to both increase statistical power and provide a comparison group against which the other categories might be tested. The ‘not assessed’ group also provides a population of case managers who might reflect early hires and other individuals whose work had not yet been measured against CSIs QA benchmarks. Below, Table 1 displays the descriptive statistics for the variables used in each model.
Table 1: Descriptive Statistics
|
Variable |
Mean/ Prop. |
|
Outcome Variables |
|
|
Completed AIC |
0.75 |
|
3-Year Re-arrest |
0.53 |
|
Client Variables |
|
|
Gender |
|
|
Male |
0.80 |
|
Female |
0.20 |
|
Race |
|
|
White |
0.45 |
|
Black |
0.31 |
|
Hispanic |
0.21 |
|
Other |
0.03 |
|
Age |
32.74 |
|
Employment |
|
|
Employed |
0.53 |
|
Unemployed |
0.33 |
|
SSI\Retired |
0.04 |
|
Unknown |
0.10 |
|
Case Manager Variables |
|
|
QA Score |
|
|
Not Assessed |
0.64 |
|
8 to 12 |
0.04 |
|
13 to 17 |
0.08 |
|
18 or More |
0.24 |
|
Tenure (Years) |
2.64 |
|
Caseload |
191.70 |
|
AIC Site |
|
|
Bridgeport |
0.47 |
|
Danbury |
0.13 |
|
New London |
0.14 |
|
Norwich |
0.17 |
|
Torrington |
0.10 |
|
N = 2229 Clients |
Results
Below, we present the results from each of the 3 sets of models focusing on the effect of QA assessment scores on 3-Year re-arrests and program completion. For each set, we focus attention only on the coefficients of interest, while omitting the various control variables in the respect of parsimony. Therefore, each model presents the effect of QA after controlling for all relevant variables displayed in Table 1. These models utilize a logistic regression, predicting the probability of either program completion or 3-year re-arrest. These models were fit using the Bayesian ‘rstanarm’ package in R (Carpenter, et al., 2017). Results presented are the posterior means and 90% credible intervals. All figures display the posterior means and 80% and 90% credible intervals. The β coefficients are the log-odds, which can conveniently be translated to the odds-ratio scale using .
Effect of QA on 3-Year Re-Arrest and Program Completion
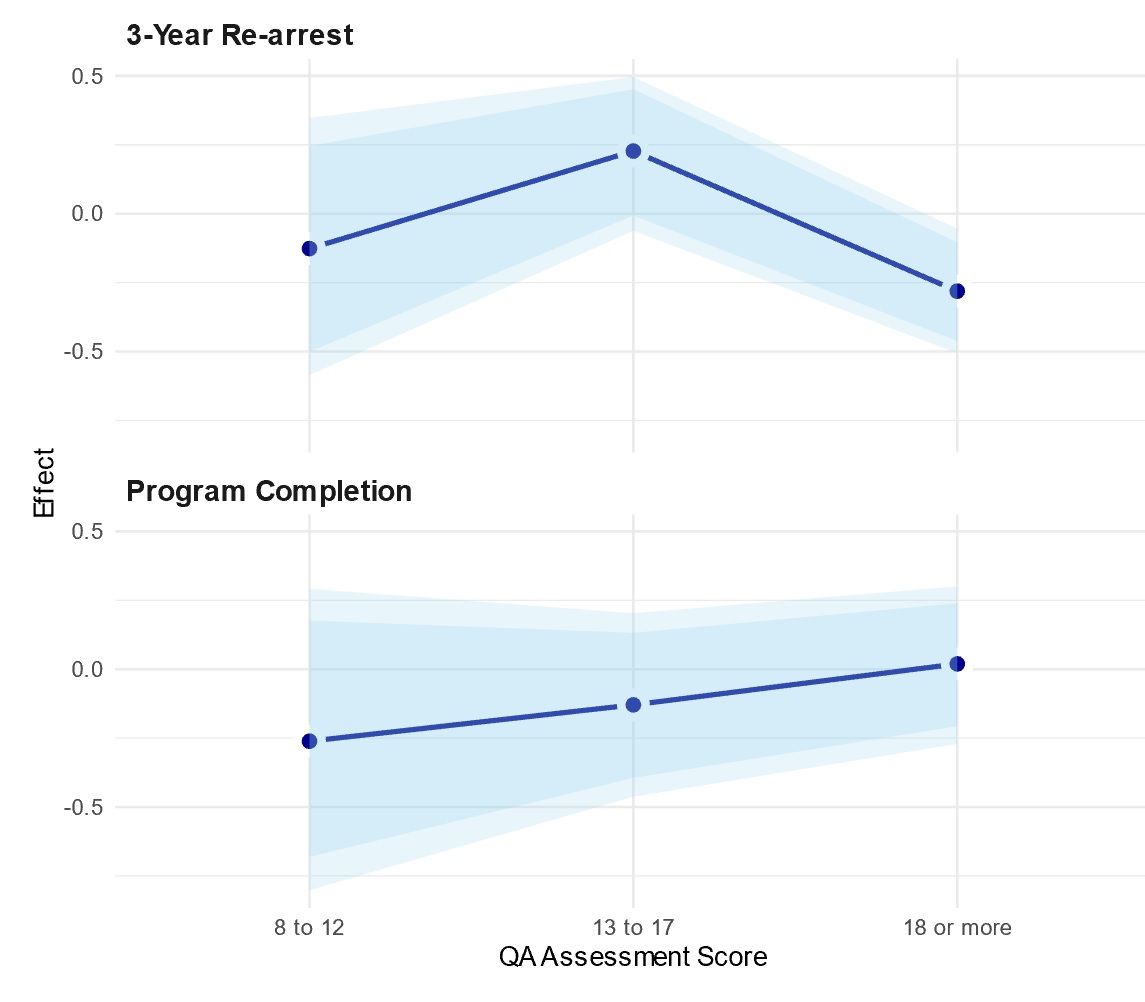
Table 2 and Figure 1 display the estimated effect of case manager QA score on overall program completion and 3-year re-arrest of their clients. In general, while program completion generally increased with QA scores, these estimates were not significantly different from zero. On the other hand, for 3-year re-arrests, clients who had case managers scoring 18 or higher were about 24% less likely to be re-arrested for any crime. At a 90% level of probability, this effect could have varied from between -41% to 7%. In general, this provides positive evidence for the effect of high-scoring QA case managers and the association with reduced 3-year recidivism in the clients they work with.
Table 2. QA on Program Completion and Re-Arrest
|
|
Program Completion |
3-Year Re-arrest |
||||||||
|
QA Assessment |
β |
|
se |
90% CI |
β |
|
Se |
90% CI |
||
|
8 to 12 |
-0.26 |
0.35 |
-0.86 |
0.33 |
-0.18 |
0.29 |
-0.60 |
0.32 |
||
|
13 to 17 |
-0.12 |
0.19 |
-0.46 |
0.19 |
0.24 |
0.18 |
-0.06 |
0.57 |
||
|
18 or more |
-0.01 |
|
0.15 |
-0.25 |
0.28 |
-0.30 |
* |
0.14 |
-0.54 |
-0.07 |
|
* Excludes 0 in 90% CI |
||||||||||
Figure 1. Effect of QA on 3-year Re-Arrest and Program Completion
Effect of QA, by Client Race
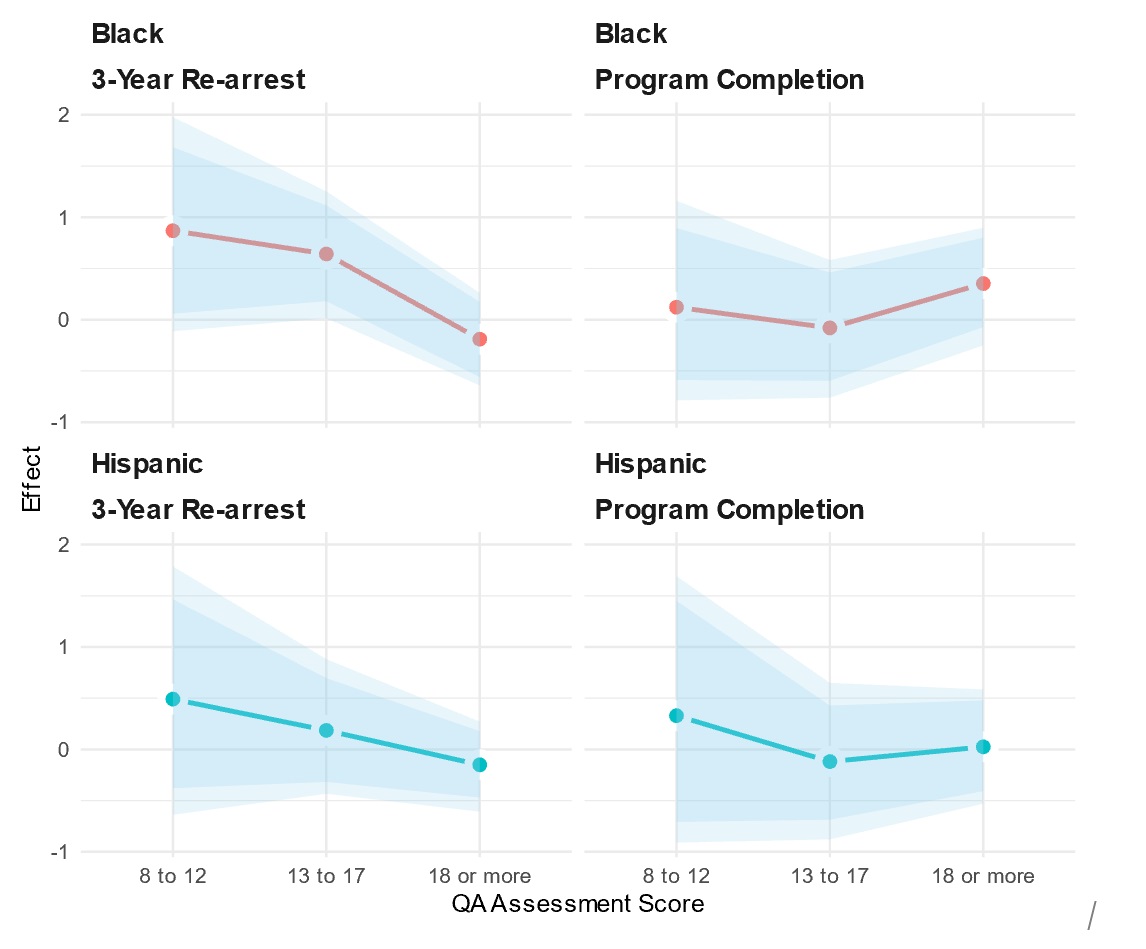
To further examine the effects of QA conditional on a client’s race, we fit a model using an interaction between QA assessment score and client race. Table 3 and Figure 2 display the effect of this interaction, which is the effect of QA relative to white clients. While the results generally point in the same direction as the first model – QA is associated with increased program completion and decreased re-arrests – the effects here are more difficult to assess. While most of the effects are not discernible relative to White clients, among Black clients, lower-scoring QA managers had clients with higher levels of recidivism and lower rates of program completion – especially for lower-mid ranked case managers (13 to 17). Among these clients, they recidivated at rate about 89% higher – however the 90% probability bounds range between (1% and 300% - a very large margin of uncertainty)
Table 3. Effect of QA, by Race (relative to Whites)
|
|
|
Program Completion |
3-Year Rearrest |
||||||||
|
|
QA Assessment |
β |
se |
90% CI |
Β |
se |
90% CI |
||||
|
Black |
8 to 12 |
0.09 |
0.60 |
-0.79 |
1.16 |
0.82 |
0.61 |
-0.11 |
1.98 |
||
|
13 to 17 |
-0.06 |
0.40 |
-0.76 |
0.58 |
0.64 |
* |
0.37 |
0.01 |
1.25 |
||
|
18 or more |
0.34 |
0.32 |
-0.25 |
0.90 |
-0.18 |
0.28 |
-0.64 |
0.26 |
|||
|
Hispanic |
8 to 12 |
0.29 |
0.79 |
-0.91 |
1.69 |
0.44 |
0.71 |
-0.64 |
1.79 |
||
|
13 to 17 |
-0.11 |
0.43 |
-0.88 |
0.65 |
0.17 |
0.36 |
-0.43 |
0.88 |
|||
|
|
18 or more |
0.01 |
|
0.34 |
-0.53 |
0.59 |
-0.15 |
|
0.25 |
-0.61 |
0.27 |
|
* Excludes 0 in 90% CI |
|||||||||||
Figure 2. Effect of QA, by Race (relative to Whites)
Effect of QA, by Client Sex
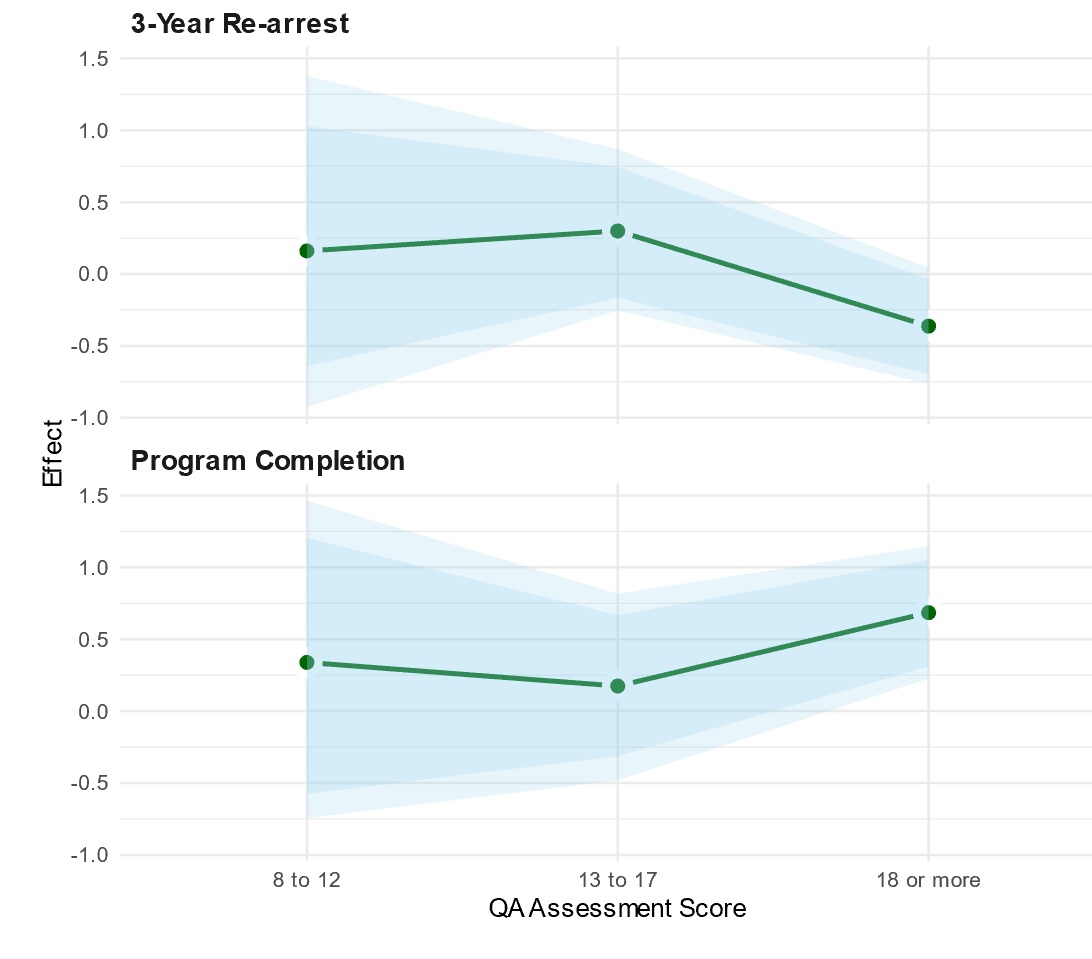
Finally, we also examined the effect of QA score on males, relative to females. Below, Table 4 and Figure 3 show the interaction estimates for males and QA score. Among male clients, QA is, indeed, associated with higher program completion among those with case managers scoring 18 or higher. Relative to females, this reflects nearly a doubling in program completion (an estimated 1.99 times as likely, or a 99% increase). For recidivism, while those clients with case managers having the highest QA scores have a decrease in 3-year re-arrest rates (an estimated 30% decrease), this effect is not significantly different from zero.
Table 4. Effect of QA, by Sex (relative to Females)
|
|
|
Program Completion |
3-Year Rearrest |
||||||||
|
|
|
β |
se |
90% CI |
β |
se |
90% CI |
||||
|
Males |
8 to 12 |
0.32 |
0.68 |
-0.74 |
1.46 |
0.10 |
0.65 |
-0.92 |
1.38 |
||
|
13 to 17 |
0.16 |
0.41 |
-0.48 |
0.82 |
0.31 |
0.35 |
-0.25 |
0.87 |
|||
|
|
18 or more |
0.69 |
* |
0.29 |
0.23 |
1.15 |
-0.35 |
|
0.26 |
-0.77 |
0.04 |
|
* Excludes 0 in 90% CI |
|||||||||||
Figure 3. Effect of QA, by Sex (relative to Females)
Discussion
A few key findings can be gleaned from this study. First, it is apparent that case managers with the highest QA assessment scores have clients with higher rates of program completion and lower overall rates of 3-year recidivism. The analysis in the primary model – focusing on all clients - identified a 24% decrease in the probability of 3-year re-arrest for those clients with a case manager scoring 18 or higher. When separated by race and sex categories, Black clients and male clients appeared to benefit more from high-scoring QA case managers in relation to program completion. This was especially pronounced for male clients, where the estimated effect was a nearly 99% increase in the likelihood of program completion.
The results from this study have two major implications. First, they provide more evidence that a rigorous, standardized QA process at the case manager level, has the possibility to increase client completion rates and reduce overall recidivism post-completion. CSI’s QA model is the method by which staff become more proficient in a specific intervention. Because all evidence-based programs require that the model is implemented with fidelity, QA is a cost-effective investment of increasing client completion as well as reducing overall recidivism rates. Second, we found some evidence that certain groups may benefit more from high-scoring QA case managers – however some of these results were mixed. In general, we observed that both minority clients and male clients may be differentially advanced by receiving service from high-scoring case managers relative to their white and female counterparts in respect to recidivism and program completion.
While most of the results do not provide strong statistical evidence, further research may be warranted since estimating interaction effects are often difficult due to increased uncertainty of model estimates. In addition, given the direction of the above estimates, they provide reason for optimism about the importance of ensuring that case managers who provide client interventions are steadily working with a QA coach to increase their proficiency, especially if they are working with black and/or male clients. More research in this area stands to improve what is known about QA procedures and how they may help organizations serve a more diverse client load. In sum, the results from this analysis find that the CSI model of QA is likely to benefit clients with a wide range of characteristics, and that these positive findings should continue to be studied further and in greater depth.
References
Barnoski, R. (2004). Outcome evaluation of Washington State’s research-based programs for juvenile offenders. Olympia: Washington State Institute for Public Policy.
Bourgon, G. (2013). The demands on probation officers in the evolution of evidence-based practice: The forgotten foot soldier of community corrections. Fed. Probation, 77, 30.
Carpenter, B., Gelman, A., Hoffman, M. D., Lee, D., Goodrich, B., Betancourt, M., & Riddell, A. (2017). Stan: A probabilistic programming language. Journal of statistical software, 76(1), 1-32.
Kras, K. R., Rudes, D. S., & Taxman, F. S. (2017). Managing up and down: Community corrections middle managers’ role conflict and ambiguity during organizational change. Journal of crime and justice, 40(2), 173-187.
Latessa, E. J., & Lowenkamp, C. (2005). What works in reducing recidivism? U. St. Thomas Law Journal, 3, 521.
Lowenkamp, C. T., Makarios, M. D., Latessa, E. J., Lemke, R., & Smith, P. (2010). Community corrections facilities for juvenile offenders in Ohio: An examination of treatment integrity and recidivism. Criminal Justice and Behavior, 37(6), 695-708.
Labrecque, R. M., & Smith, P. (2017). Does training and coaching matter? An 18-month evaluation of a community supervision model. Victims & Offenders, 12(2), 233-252.
Schlager, M. D. (2009). The organizational politics of implementing risk assessment instruments in community corrections. Journal of Contemporary Criminal Justice, 25(4), 412-423.
Viglione, J., Alward, L. M., & Sheppard, D. L. (2020). Staff Training Aimed at Reducing Rearrest: Probation officer attitudes and experiences. European Journal of Probation, 2066220320976101.
Viglione, J., & Labrecque, R. M. (2020). Core correctional practices in community supervision: An evaluation of a policy mandate to increase probation officer use of skills. International Journal of Offender Therapy and Comparative Criminology, 0306624X20981045.
Wandersman, A. (2014). Getting to outcomes: An evaluation capacity building example of rationale, science, and practice. American Journal of Evaluation, 35(1), 100-106.
Photo by Nathan Anderson on Unsplash


"EBP Day" Event Login Portal

Evidence-Based Professionals' Monthly - December 2025
Evidence-Based Professionals' Monthly - January 2026
Evidence-Based Professionals' Monthly - February 2026
Evidence-Based Professionals' Monthly - March 2026

Substance Use Disorders (SUDs) Masterclass: Core & Advance Skills for Evidence-Based Practitioners
Trauma Informed Care Services
EBP Day - Our Free Annual Planning Event
